
Statistics section: show your key figures and results
Highlight your numbers (customers, countries, rating, study results) with animated counters and circle, semicircle or bar gauges.
The Statistics section shows a few strong numbers: "120K+ customers", "4.8/5", "92% see a more even complexion". The numbers count up to their value when the section comes into view, which catches the eye. Place it on the home page, an "Our story" page or below a product page, wherever customers need proof.
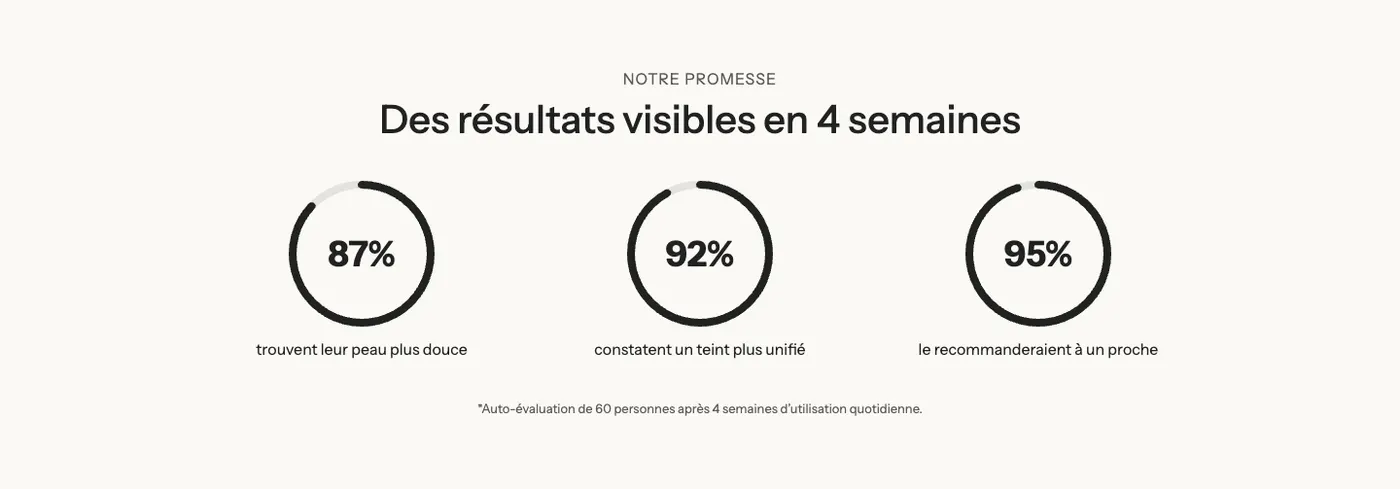
The variants (presets)
Results
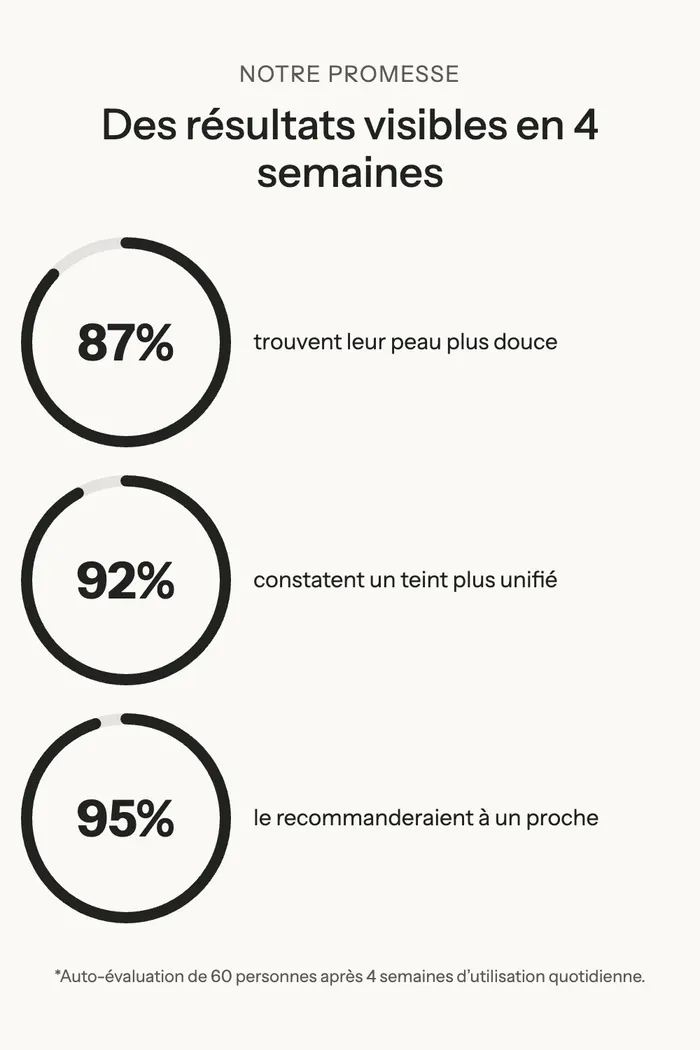
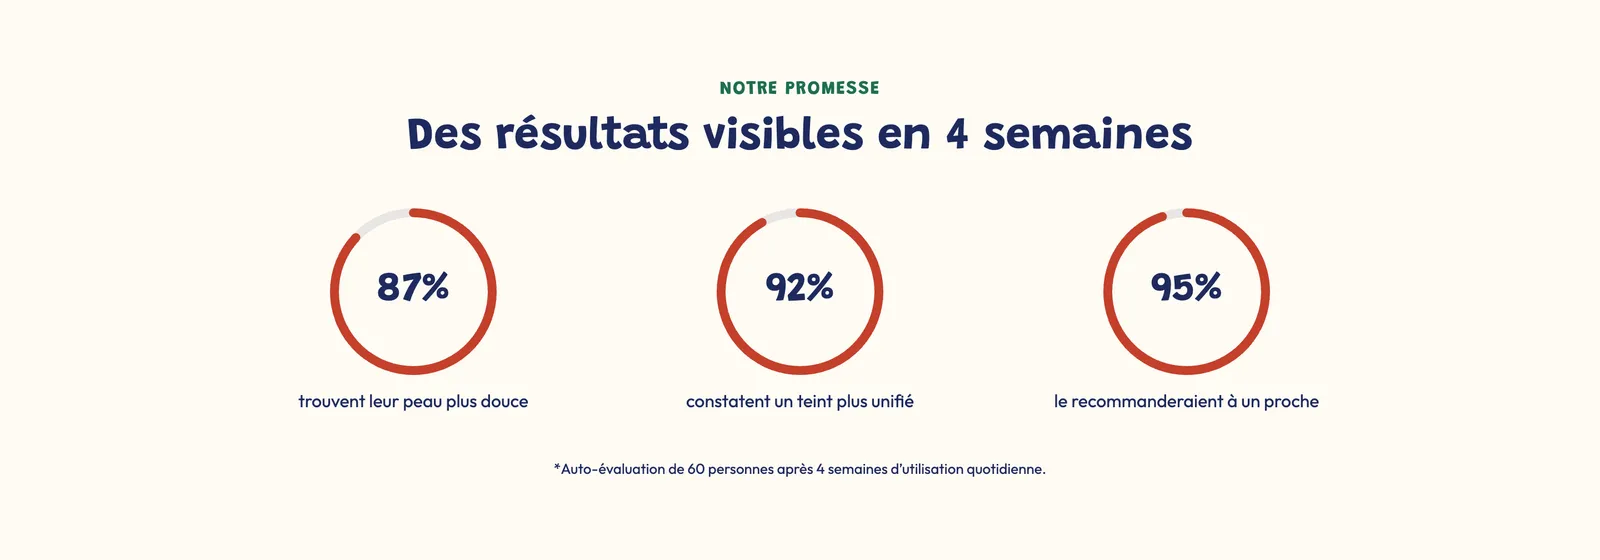
A heading, three circle Progress bar blocks and a note text ("Self-assessment by 60 people after 4 weeks…"). It's the variant for study, satisfaction or effectiveness results. On mobile, each circle sits to the left of its sentence.
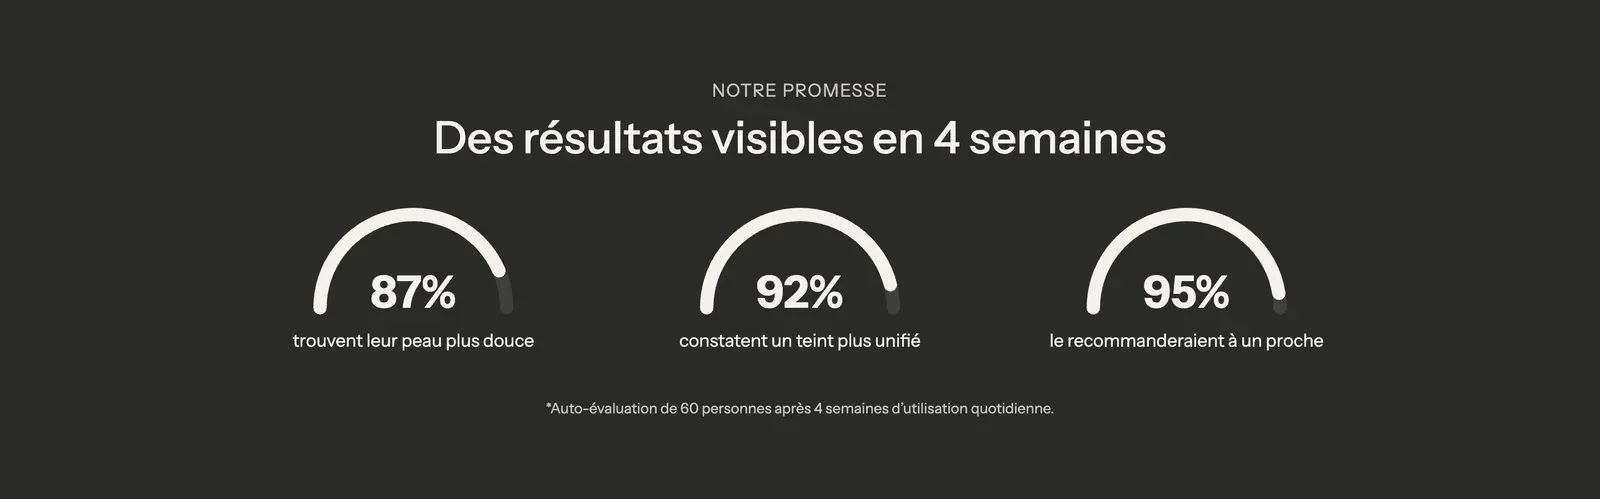
The same variant with the Semicircle style, on a dark palette:
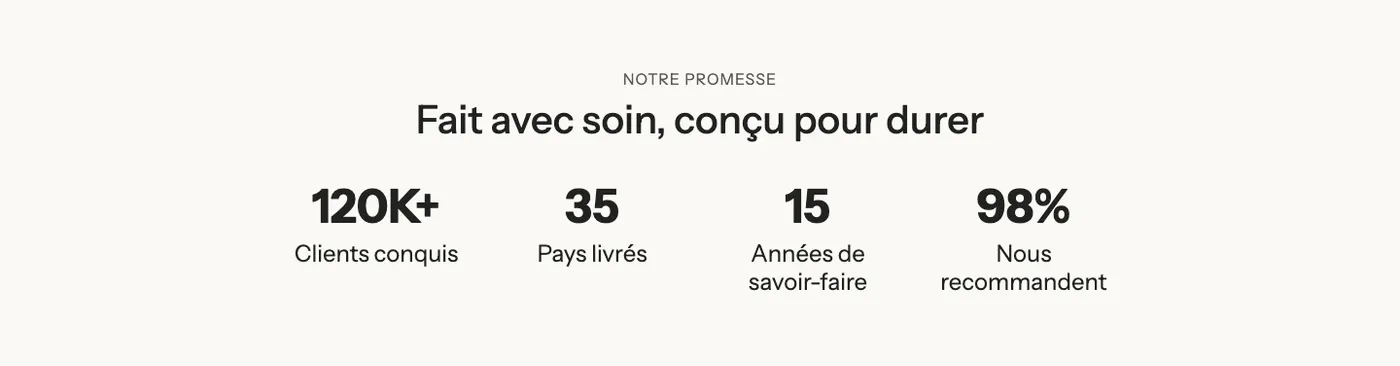
Key figures
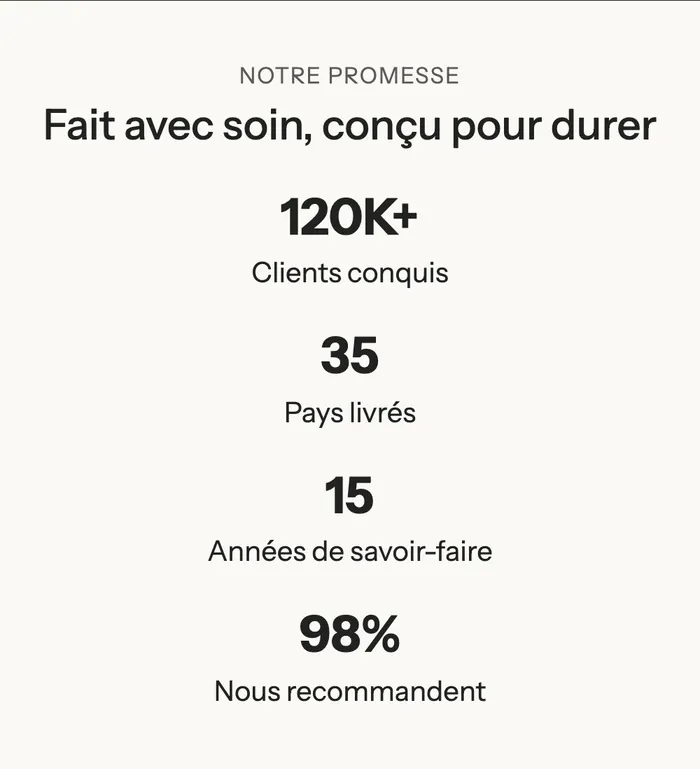
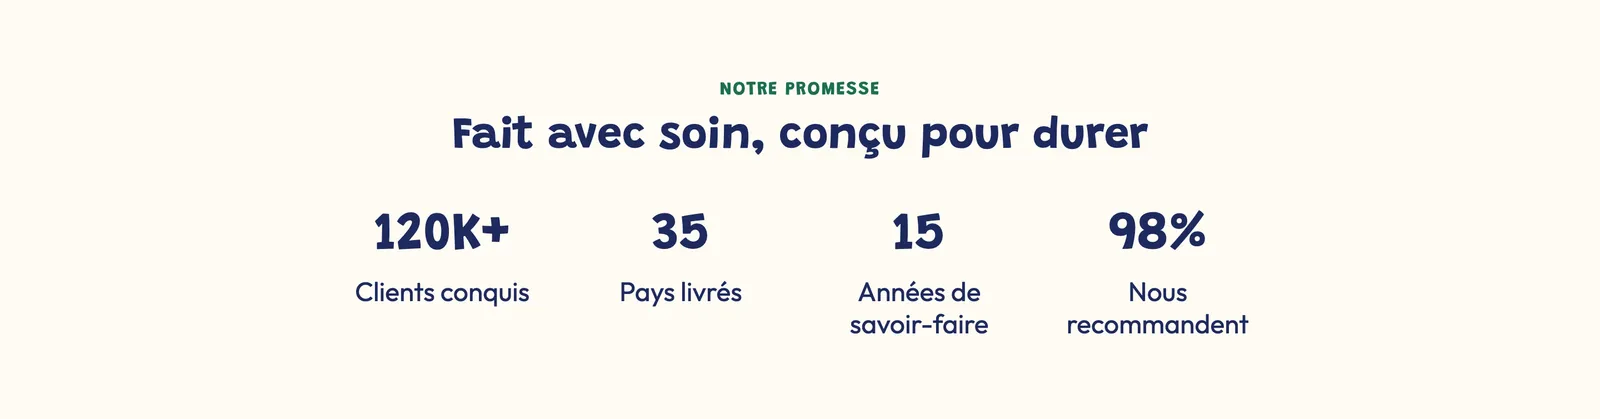
A heading and four Counter blocks: large numbers with a label below. It's the variant for brand figures: customers, countries shipped to, years of experience, recommendation rate.
With the section Direction set to Horizontal, the heading moves to the left and the numbers line up on one row:

On mobile, the counters stack:
Add the section
- In your Shopify admin, open Online Store > Themes and click Edit theme.
- Pick the template in the top menu (for example Home page).
- Click Add section, open the Selling points category and choose Results or Key figures.
- Open the section's Group and click each Counter or Progress bar to enter your numbers.
- Click Save.
The section's blocks
| Block | What it's for |
|---|---|
| Heading | The subheading and heading above the numbers. |
| Group | Lines up the numbers side by side (and stacks them on mobile). |
| Counter | A number that counts up to its value, with a label. |
| Progress bar | A bar, circle or semicircle gauge. |
| Text | The note below the numbers (source, study conditions). |
To add a number, click Add block in the Group and choose Counter or Progress bar (Selling points category).
Counter
- Heading: the number. Put it in curly braces, with the text you want around it:
{120}K+,€{1,500}or{4.8}/5. Only the part inside the braces is animated. - Subheading: the label below the number ("Happy customers"); Description: an extra sentence, optional.
- Icon or Custom image above the number (none in the variants).
- Heading font size (and on mobile), Color, animation Duration (1.5 s by default), Alignment.
- Button group: Button text, Button link, Button style.
Progress bar
- Content group: Style (Bar, Circle or Semicircle), Value from 0 to 100, Suffix ("%" by default), Label, Description, Count up when visible (checked by default).
- Layout group: Layout (Stacked or Side by side) and Mobile layout, Alignment, Size, Thickness, Text size.
- Colors group: Progress color, Track color, Text color (when empty: the theme colors).
The section settings
The section has the frame shared by almost every section: Layout (including Direction, vertical in both variants), Color palette, Separators and Animations. It's explained in Understand the theme editor.
Tips and pitfalls
- Three or four numbers, no more. Beyond that, none stands out.
- Only show true, verifiable numbers, and cite their source in the Text below the gauges (sample size, duration, self-assessment). A satisfaction figure with no source raises suspicion.
- A rounded number with a suffix (
{120}K+) reads faster than an exact one (120,437). - A progress bar's Value goes from 0 to 100: it's made for percentages. For any other number, use a Counter.